消費模式差異
多份報章都報道了全國統計局最新公布的國民消費調查結果。《衛報》列表顯示50年前同今天英國人消費模式的差異。
五十年前,人們每周的消費中最大筆開支用於房屋,第二是煙草,第三是出外吃飯,第四是汽車﹔今天人們的最大筆開支用於支付房屋貸款利息,第二大是租金,第三大是汽車燃料,第四是地方稅。
五十年前,人們收入的33%用於食物,16%用於其他貨物及服務﹔今天人們花29%用於其他貨物及服務,19%用於房屋。
Housing costs dominate family expenditure

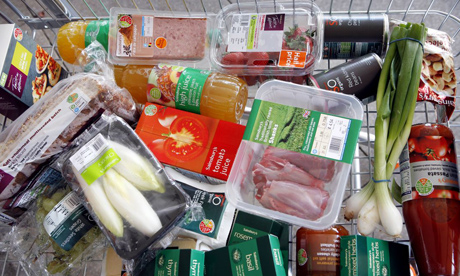
Spending on food and drink as a proportion of total expenditure has dropped. Photograph: David Sillitoe
The proportion of a UK household's budget that goes on keeping a roof over the family's head has more than doubled in the past 50 years, according to official figures released today.
Housing costs such as mortgage interest and rent now take up the biggest slice of the weekly budget - an average 19% compared with 9% in 1957, according to the Office for National Statistics (ONS).
Meanwhile, spending on food and non-alcoholic drinks has dropped sharply from 33% of a weekly household budget in 1957 to just 15% last year.
The figures are published in the ONS's latest Family Expenditure Survey, which has now been running for 50 years, and are based on a survey of nearly 7,000 households in 2006.
They show that the average family spent £456 a week, with £143 going on housing and related costs, including council tax and home improvements.
The average total weekly household expenditure was highest among households of three or more adults and children, and amounted to £700 a week.
At the other end of the scale, one-person retired households mainly dependent on the state pension reported spending £138 a week.
After housing costs, transport took up the lion's share of the average household budget, clocking in at £62 a week.
This included £23.40 on the purchase of vehicles, £28.60 on operational costs such as petrol, repairs and servicing, and £10 on public transport such as rail, tube and bus fares.
Spending on recreation and culture, which includes purchasing books and TVs, as well as package holidays, came next at £58 a week.
Food and non-alcoholic drink purchases contributed £47 to weekly household expenditure, of which £12.50 went on meat, £3.60 on fresh vegetables and £2.90 on fresh fruit.
Greater disposable income
Comparing the figures for 2006 with those for 1957, it seems greater disposable income has pushed up spending on leisure goods and services, with the average outlay on them rising from 9% to 19%.
"Expenditure on leisure remained fairly stable until 1977. From 1977 until 2006 the expenditure has increased at a greater rate than in the 20 years between 1957 and 1977," said the report.
A fall in the number of smokers has meant a big drop off in spending on tobacco, from 6% of weekly spending in 1957 to just 1% now, but spending on alcoholic drinks has remained unchanged at 3% of the average weekly household budget.
Spending on motoring and travel costs has risen from 8% to 16% over the same period.
Clothing and footwear take a smaller cut of the average household budget, down from 10% in 1957 to just 5%.
The report also includes lists of the top 50 spending categories in 1957 and 2006, although these are not directly comparable because of a change in the assessment criteria.
In 1957 the top 50 included 20 items of food and drink including fresh milk, beef and veal, mutton and lamb, and sugar.
In the latest report, the top 50 items as a proportion of household spending include just 10 food and drink items, among them takeaway and snack food.
Fresh vegetables did not appear at all in 1957, but are now ranked in 34th place.
沒有留言:
張貼留言